Project Management Guide: Gantt, Kanban and Task Management
A practical guide to managing projects with Gantt charts, Kanban boards and task tracking inside your CRM.

You closed the deal. The client signed. Now the real work begins — and suddenly you realize the sales process was the easy part. Delivering the project on time, on budget, with a happy client at the end is where most SMEs struggle. Tasks get lost in chat messages, deadlines slip without anyone noticing, and the question "who is handling this?" echoes through the office daily.
The gap between selling and delivering is where small businesses lose margins, reputation and sleep. A well-structured project management system bridges that gap. But most SMEs either use nothing (email and memory) or tools that are completely disconnected from where the deal information lives.
What if your project management lived inside the same system as your sales pipeline? No data re-entry, no context switching, no "let me check the other tool." This guide shows you how to use Gantt charts, Kanban boards and task management to deliver projects that make clients come back.
Why project management fails in SMEs
The most common reason projects go off track in small businesses is not a lack of effort — it is a lack of structure. The sales team closes a deal with specific commitments: deliverables, timelines, pricing, expectations. But when the deal moves to the delivery team, the handoff is often incomplete. The project brief says one thing, the deal record says another, and the client's verbal instructions during the last call were never documented at all.
This information disconnect between sales and delivery creates problems from day one. Tasks are assigned based on incomplete information. Timelines are set without understanding the true scope. And when something goes wrong — as it inevitably does — nobody has the full picture needed to course-correct quickly.
The second failure mode is the illusion of control. Many teams hold weekly update meetings where everyone reports on their progress. This feels productive, but it is actually a lagging indicator — by the time someone reports a problem in a weekly meeting, the problem has been festering for days. In a fast-moving project, that delay is the difference between a minor adjustment and a major crisis.
Late delivery kills more than the current project. It kills recurring revenue and referrals. A client who receives their deliverable two weeks late does not just feel disappointed — they tell their network. In SMEs where word of mouth drives a significant portion of new business, the cost of late delivery extends far beyond the immediate project.
Kanban: visual simplicity for everyday work
Kanban is the project management approach that most teams adopt first, and for good reason. It is visual, intuitive, and requires almost no training to understand.
The concept is simple: a board with columns representing stages of work, and cards representing individual tasks that move from left to right as they progress. A typical setup might include four columns: To Do, In Progress, Review, and Done. Each card shows the task name, the person assigned to it, the due date, and optionally a checklist of subtasks.
The power of Kanban lies in its visual immediacy. A single glance at the board tells you everything: what is being worked on, what is waiting for review, what is done, and — critically — where the bottlenecks are forming. If you see fifteen cards piled up in "Review" and only two in "In Progress," you know that the review process is the constraint. No report needed, no meeting required — the board speaks for itself.
Kanban is the ideal approach for ongoing operational work with no fixed end date — client service delivery, content production, support ticket management. It excels in teams that need flexibility and fast reprioritization, where priorities shift daily and rigid timelines would create more friction than value.
Customizing the columns to match your specific workflow is essential. A marketing team might use "Briefing, Creation, Client Review, Revision, Published." A service team might use "Request Received, Scheduled, In Progress, Quality Check, Delivered." The columns should mirror the actual steps your team follows, not an abstract ideal.
Gantt: timeline control for complex projects
Where Kanban excels at showing what is happening, Gantt charts excel at showing when. A Gantt chart plots tasks on a horizontal timeline, with each task represented as a bar whose length indicates its duration. Start dates, end dates, and dependencies between tasks are all visible at once.
Dependencies are the killer feature of Gantt charts. When task B cannot start until task A is complete, the Gantt chart shows this relationship explicitly. If task A is delayed by three days, you instantly see the cascade effect on task B, task C, and every downstream activity. This visibility is critical for projects with sequential phases — a website redesign where design must be approved before development begins, or a product launch where manufacturing depends on finalized specifications.
Milestones mark critical checkpoints in the project timeline. They are not tasks with duration — they are points in time that represent significant achievements: "client approves design," "beta version delivered," "go-live." Milestones give both your team and your client a shared understanding of when major phases complete.
Resource allocation becomes manageable with Gantt views. When you can see that two of your team members are assigned to three projects simultaneously during the same week, you can redistribute the workload before the crunch happens — not after someone burns out or misses a deadline.
The trap to avoid with Gantt charts is over-planning. A Gantt with 200 tasks and 50 dependencies becomes a maintenance burden that nobody updates. For SMEs, the sweet spot is typically 10-30 tasks per project with key dependencies mapped. The chart should be a helpful tool, not a full-time job to maintain.
Gantt is the right choice for projects with fixed deadlines and sequential dependencies: construction projects, event planning, product development, and any engagement where a client needs to see a timeline. It is also invaluable when managing multiple concurrent projects and needing to understand how resources are allocated across them.
Task management: the foundation of both
Whether you prefer Kanban, Gantt, or a combination, task management is the foundation everything else is built on. Getting task management right means every piece of work is captured, assigned, tracked, and completed — nothing falls through the cracks.
The most powerful task management starts at deal closure. When a sale is won, the CRM can automatically create a project with pre-defined tasks based on the service sold. A web design deal might generate tasks for "kickoff call, wireframe creation, design mockup, client review, development, QA testing, launch." The handoff from sales to delivery is seamless because the project inherits all the deal context.
Checklists inside tasks break large pieces of work into manageable steps. A task like "prepare client presentation" might include sub-items for "gather analytics data, create slide deck, review with manager, send to client." As each item is checked off, progress becomes visible at a granular level.
Assignments and notifications ensure accountability. Every task has an owner and a due date. When a deadline approaches, the assignee receives a reminder. When a task is overdue, the assignee and their manager are both notified. This is not micromanagement — it is structured awareness that prevents small delays from snowballing into project failures.
Tags and priorities allow teams to filter through the noise. Urgent tasks surface above routine ones. Tasks tagged by client, project phase, or skill area can be filtered to show each team member exactly what they need to focus on.
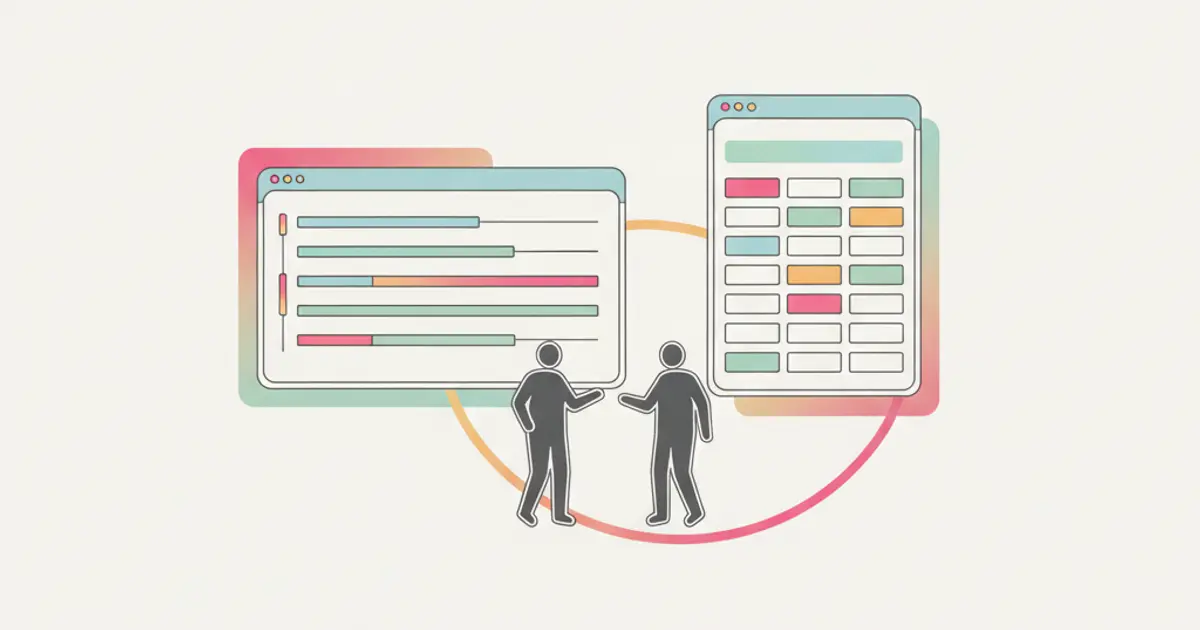
Combining views for maximum visibility
The real power emerges when you combine Kanban, Gantt, and task management into a unified project dashboard that serves different audiences with the same underlying data.
The project overview dashboard shows health status, progress percentage, and overdue alerts across all active projects. At a leadership level, this view answers the question "are we on track?" without requiring a single meeting.
Switching between Kanban and Gantt views based on context is natural. Use Kanban for the daily standup — "what are you working on today?" Use Gantt for the client review meeting — "here is where we stand on the timeline." Both views reflect the same tasks, the same assignments, and the same statuses. There is no duplicated data and no conflicting information.
A client portal gives your clients visibility into project progress without exposing internal discussions or sensitive data. Clients can see which milestones have been reached, which tasks are in progress, and when the next delivery is expected. Automated status updates notify the client when milestones are completed, reducing "where are we?" emails to near zero.
Project data also feeds into revenue and margin reports. When you know the estimated hours, the actual hours logged, and the deal value, you can calculate project profitability in real time. This insight helps you price future projects accurately and identify which types of engagements are most profitable — data that directly improves your sales strategy.
Best practices for SME teams
If you are introducing structured project management for the first time, start simple. Three columns and five tasks per project is enough to prove the concept. Resist the urge to create an elaborate system on day one. Let the team use a basic structure for two weeks, then add complexity where they feel the need for it.
Establish a weekly review ritual — a 15-minute meeting where the team walks through the Kanban board or Gantt chart together. This is not a status update meeting (those can happen asynchronously). It is a brief alignment session focused on blockers, risks, and reprioritization. Fifteen minutes of prevention averts hours of crisis management.
Templates are a multiplier for teams that deliver similar types of projects repeatedly. Create a project blueprint for each recurring service type — a standard website project, a monthly retainer, a consulting engagement. When a new deal closes, the template generates the full task structure in seconds, pre-populated with assignments, durations, and checklists. This ensures consistency and dramatically reduces setup time.
Integrating project management with invoicing creates a natural billing rhythm. Instead of invoicing based on dates, you invoice based on milestones — when "Phase 1 Complete" is marked done, the corresponding invoice is generated automatically. Clients appreciate milestone-based billing because it ties payment to value delivered, and your cash flow improves because you bill as soon as work is completed.
The metric that matters most for project delivery is on-time delivery rate. Track it religiously. If your team delivers 90% of projects on time, you have a healthy operation. If the number is below 70%, you have a systemic issue that no amount of working harder will fix — it requires structural changes to how you plan, assign, and monitor work. And with the right tools inside your CRM, those structural changes are surprisingly straightforward to implement.
Share this article
Written by
Flusia Team
Related articles
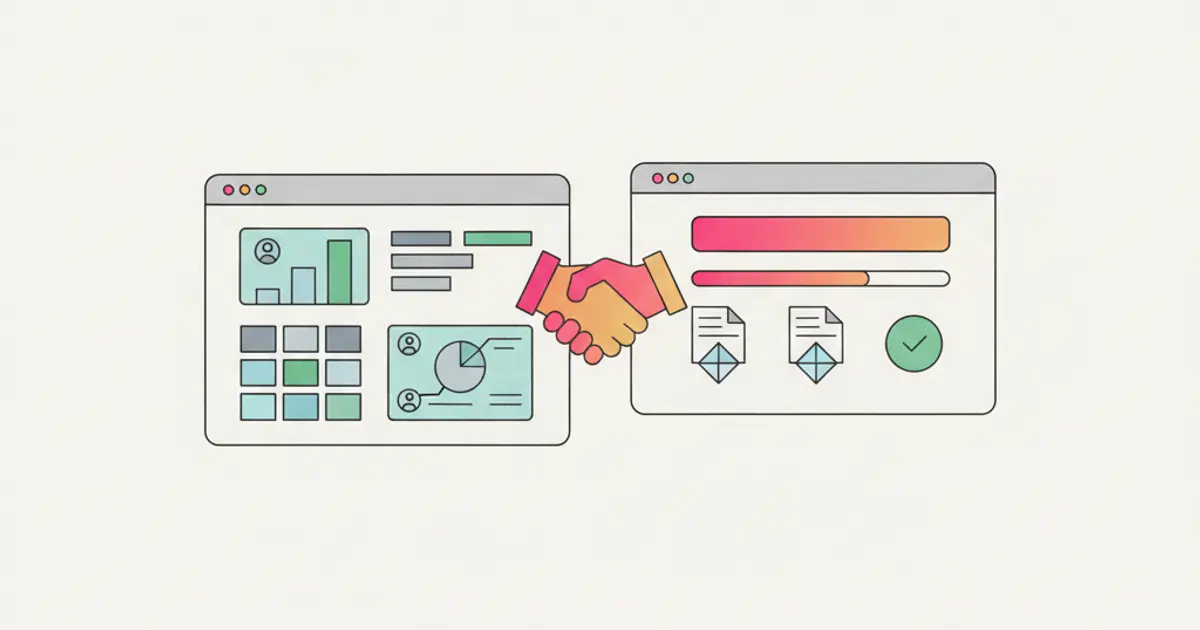
Client Portal: Transparency That Builds Loyalty
Discover how a client portal integrated in your CRM improves transparency, reduces support requests and builds lasting client loyalty.
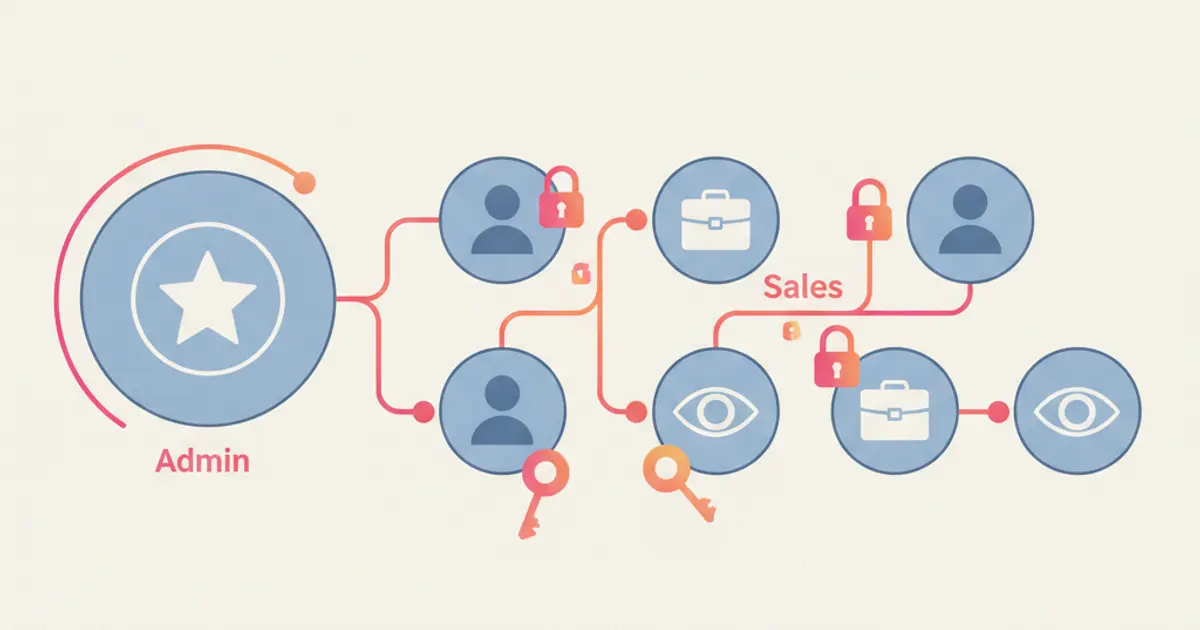
CRM Roles and Permissions: How to Structure Your Team Without Chaos
Learn how to set up roles, permissions and data visibility in your CRM to keep your team organized and your data secure.
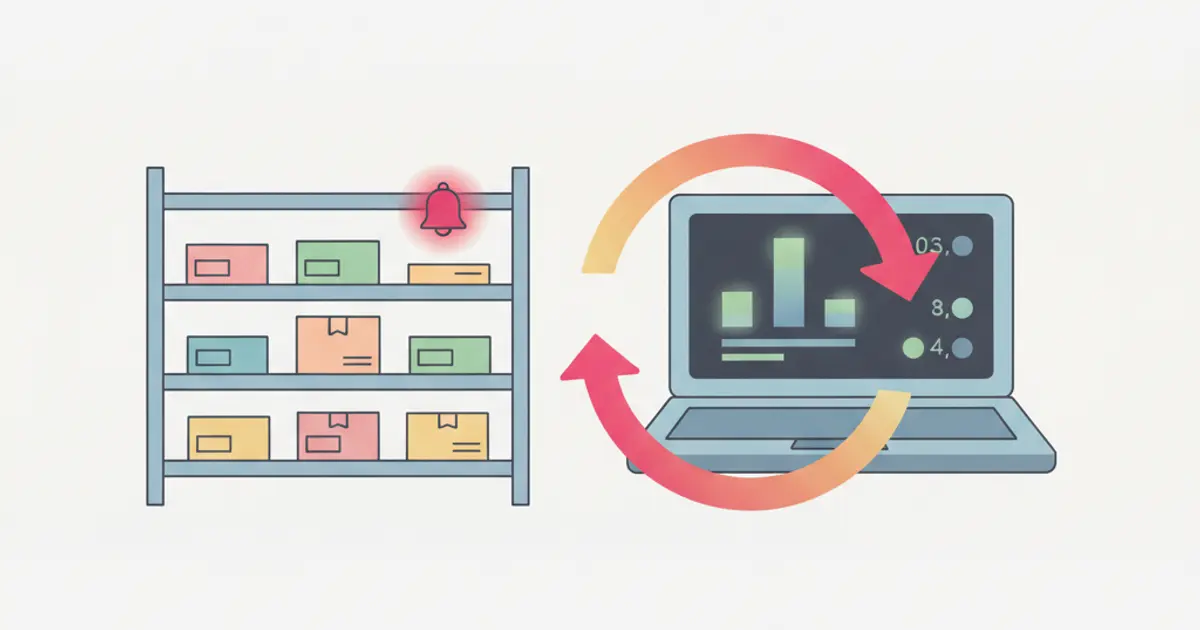
Warehouse Management in CRM: Inventory, Stock and WooCommerce
Learn how to manage inventory, stock alerts and WooCommerce sync directly from your CRM — built for SMEs with a warehouse and e-commerce.